Simple Tips to Design Surveys That Drive Real Change
These ideas will help you create constituent surveys that yield better data.
By Zahir I. Latheef
Contributor

November 20, 2025 | Read Time: 7 minutes
Surveys are a popular tool for collecting feedback from donors and program participants. Inexpensive and easy to send, they’re a visible way to engage constituents and signal an openness to outside ideas.
But there’s a major caveat: While well-designed surveys can uncover useful insights to inform organizational strategy, poorly written questionnaires produce misleading or incomplete data. If you don’t understand their limitations, relying on survey results to drive program decisions can be risky.

To engage your stakeholders and collect better information, you’ll want to follow proper survey methodology and avoid common pitfalls. Here are simple ways to improve your questionnaires and yield valuable insights you can use to bolster your programs.
Develop a marketing plan to target your sample.
Due to time, access, or cost considerations, not every person surveyed will respond. Analysts draw conclusions based on the portion of the population that completes the survey — in other words, a sample. The challenge is that the sample may not be representative of the entire community, which can c
For example, imagine you lead a nonprofit that wants to start an after-school tutoring program for local students. A natural first step might be to distribute a survey to gauge the community’s interest and support. While this approach may seem straightforward at first, the survey’s shortcomings will quickly become apparent.
If certain groups are over- or underrepresented, the results will be skewed. If members of one ethnicity make up 25 percent of the community but account for 70 percent of survey responses, the sample is not representative of the population. If only 10 percent of the respondents are women, then women’s perspectives are not well-represented in the data. Compounding the problem, when demographic questions are omitted from the survey or left blank, analysts may not even realize the results are off.
To overcome this challenge, define your audience clearly and develop a targeted dissemination strategy to reach that population. Surveys need a marketing plan that uses multiple channels to improve response rates.
To increase response rates, design shorter questionnaires that are organized in a user-friendly way. For example, some people may find an online survey difficult to navigate but will happily answer questions over the phone. If language barriers exist in your region, offer translated versions of the survey. When using social media, recognize there are demographic differences between platforms — for example, people who take surveys on Facebook skew older than those who respond on Instagram or TikTok.
Talk to your most highly informed stakeholders separately.
Respondents likely have differing levels knowledge of your cause, resulting in a sample mixed with a broad spectrum of “informed” and “uninformed” respondents. For example, a community respondent may answer based on limited understanding, while a former board member or core volunteer brings years of experience and context. Traditional surveys weigh all responses equally, masking these important differences.
In the example of the tutoring program survey, many respondents may base their answers on the assumption that “tutoring sounds good” without considering the costs of staffing, volunteer management, or sustainability. Their responses will be counted the same as those of stakeholders with a deeper understanding of what it takes to launch the program.
A member engagement pyramid is a useful framework for categorizing different levels of meaningful participation in a nonprofit. At its base are the observers and followers of the organization, and at higher levels are the individuals who are more deeply involved: those who endorse, contribute, take ownership, and ultimately lead your group. While less engaged voices matter, too often surveys lump all levels of the pyramid together, ignoring key differences in knowledge and investment.
Gather insights from highly informed people at the top of your pyramid — your subject-matter experts, long-time volunteers, and donors — through interviews, focus groups, or advisory councils. In this way, the leadership team benefits from the richness of their experience.
Learn the limitations of plurality voting.
Plurality voting is often the default in survey design, but it doesn’t generate useful data in all circumstances. In this method, respondents are given a set of choices and asked to indicate their preference. When the results are analyzed, each vote counts as one point for the chosen item.
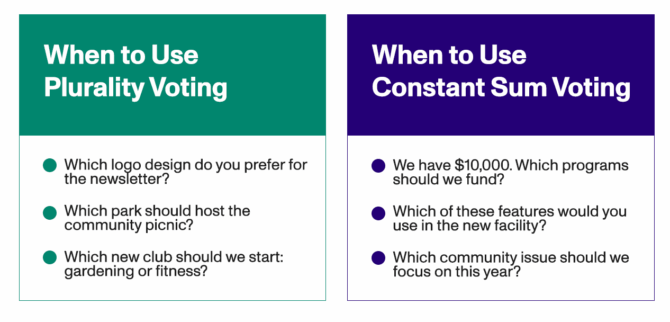
Plurality voting can be appropriate for low-stakes, mutually exclusive choices, such as a new logo design. However, in more complex matters, such as deciding which programs to fund, plurality voting can undermine the usefulness of the results by weighting answers from informed and uninformed respondents the same.
This problem is exacerbated when the number of highly engaged stakeholders make up a small proportion of a community. By sheer power of numbers, the feedback of the general population drowns out the opinions of the most informed respondents. Anonymous surveys further muddy the waters because analysts cannot distinguish between uninformed and informed respondents.
For a community survey, you can include a question asking respondents to identify which of the nonprofit’s programs or services they participate in. This could be a frequency measure using a Likert scale, or it can be a list of specific programs in which participants “check all that apply,” with “none” as a possible answer. Results can then be weighted based on levels of engagement.

Finally, give all respondents the opportunity to add their contact information if they would like to share additional feedback with nonprofit staff.
Use response options that capture nuance in opinions.
Posing questions for an up-or-down vote should be used sparingly and handled with caution. Surveys should avoid binary choice questions, like “yes” or “no.” Consider adding a third choice such as “neutral,” “unsure,” or “maybe.” Rating scales — from 1 to 5, or 1 to 7 — also make room for more nuance in responses.
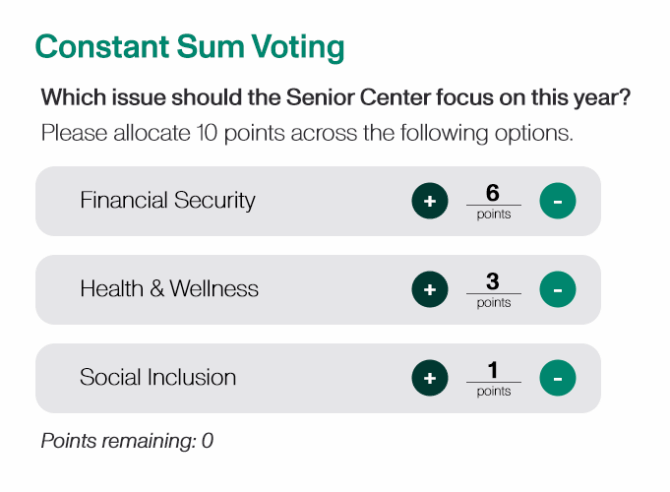
Alternatively, you could use a method to allocate points, also known as a constant-sum scale. In this approach, respondents distribute a fixed number of points in any way they please. For example, for a survey from a nonprofit senior center on how to prioritize community programs, this respondent awarded 10 total points across three options: 6 points to financial security, 3 points to health and wellness, and 1 point to social inclusion.
Another version of this is negative voting, in which each respondent chooses an option to vote for (1 point) and an option to vote against (-1 point). The points are tallied up for each option and the winner is the one with the highest score. Both methods enable respondents to share the intensity of their preferences.
Be careful not to alienate those with minority opinions.
Community surveys often measure what people think but not how strongly they feel. In the previous example, let’s say that to offer academic tutoring, the nonprofit would need to redirect funds and discontinue a long-standing sports program, scheduled at the same time. When asking community members to vote on the tutoring launch, the results indicate 65 percent in favor and 35 percent opposed. On the surface, this may look like a green light to move forward.
However, aside from the potential for sample bias and unequal understanding, two additional challenges arise.
First, if leaders use the survey results to dictate the decision, they may alienate 35 percent of the community. This is called the tyranny of the majority, in which minority viewpoints are not given due consideration because they did not meet the 51 percent threshold. In a community organization in which managing stakeholder expectations is central to success, listening to minority opinions is paramount.
Second, there may be situations in which minority respondents are strongly opposed to the decision, while those in the majority are lukewarm.
For instance, families who perceive sports as central to their children’s well-being may resent the decision to end the sports program. If the leadership team decides to launch the tutoring program based on the lukewarm majority preference, they risk underestimating the passion and resistance of the minority, creating conflict and eroding trust.
Give surveys their rightful place in nonprofit decision-making.
Leadership teams should not rely solely on information generated by surveys to guide complex strategies, but community insights have their rightful place. Use survey data as one source of input within a multifaceted process to involve stakeholders. By doing so, you can make higher-quality and more inclusive decisions and advance your mission with confidence.
Zahir Latheef is an associate professor of management at the University of Houston–Downtown’s Marilyn Davies College of Business, where he teaches courses in leadership and team dynamics. Outside of the classroom, he has served on the boards of several nonprofits over the past two decades.