Podcast: Nonprofit Creates Maps to Aid in Relief Efforts Around the World
August 3, 2018 | Read Time: 27 minutes
This week’s Business of Giving features Tyler Radford, executive director of Humanitarian OpenStreetMap Team, whose volunteers use satellite imagery to help draw detailed maps, including for parts of the world for which maps are unavailable. The maps are on an open platform and help first responders and relief organizations reach those in need after disasters such as the 2010 earthquake in Haiti and Hurricane Maria in Puerto Rico in 2017. Radford says the data can ease development challenges in health, finance, and infrastructure in many countries.
Listen to the podcast, which is hosted by Denver Frederick, or read the transcript below.
Denver: When you’re driving in your car, and the voice from the phone says, “Take exit 3 in two miles,” that’s a result of the area being well-mapped. But there are parts of the world that are largely unmapped, and they happen to be the very parts wherein natural disaster is likely to strike. So, providing emergency relief to people without any map to go by is a monumental challenge. Fortunately, there is a young, creative organization that has stepped up to fill that gap, and with volunteers no less. It is the Humanitarian OpenStreetMap Team or HOT, and it’s a pleasure to have with us their executive director, Tyler Radford. Good evening, Tyler, and welcome to The Business of Giving.
Tyler: Good evening, Denver. Very happy to be here with you tonight.
Denver: Tell us about HOT, Humanitarian OpenStreetMap Team, and the mission of the organization.
Tyler: HOT, as you mentioned, has a unique mission, and it’s one that most people don’t realize is a problem today in that many areas of the world are simply unmapped and don’t appear on any world map. So, what we do is we work through the power of thousands of volunteers on providing them satellite imagery. They help to create maps of these vulnerable areas that are then used on the ground after a disaster to help get the right people and supplies to the right places at the right time.
Denver: If there was a moment of inception for HOT, it would be January 12, 2010 when a magnitude 7 earthquake hit Haiti. Tell us about the immediate aftermath of that and the role that these volunteers played in mapping.
Tyler: If we think back to 2010, it was an incredibly difficult time after the earthquake. We had the entire infrastructure in Haiti that had been completely decimated. By some estimates, literally hundreds of thousands of Haitians lost their lives, as well as many of the organizations that were working in Haiti to help provide support and relief. What was discovered to be an immediate challenge was that after the earthquake, there was almost no publicly available information on what had happened to whom and where, and who was most in need.
So, this platform that had been invented– I would call OpenStreetMap– about five years before the earthquake, it was a tool that people were using to help create maps of the world, and it was a really ambitious project to map the entire world in this openly available platform. After the earthquake in Haiti, we had a few dozen volunteers come together and say, “What if we actually mapped street by street, building by building, the areas that were affected by the earthquake and then made that map available to the responders on the ground to load on to their GPS devices, to help them navigate, to help them find people that were in need?” And those few dozen volunteers quickly grew to several hundred volunteers. And within a matter of a few weeks, those several hundred volunteers actually created very highly detailed maps of the area that was affected and were able to get those maps to the responders on the ground in Haiti.
Denver: Fantastic. Those few hundred volunteers are now about 127,000 volunteers who commit to do this. Who are these folks?
Tyler: The 127,000 volunteers that have worked with us since the Haiti earthquake, they really come from all walks of life. We have professional geographers and cartographers working with us. More frequently, it’s everyday people, sometimes as young as 8-year-olds up to 80-year-olds. These are people who have a real desire to have a positive impact in the world. They often see an event or disaster take place on TV, and they want to do something meaningful to contribute. What we’re seeing more and more is that people are looking for alternatives. Instead of giving that $10 or $20 to a relief organization, they say, “I want to get a little more hands-on, and I want to be able to see my contributions at work.”
By actually mapping with us in OpenStreetMap, it’s a way for them to visibly see areas that were affected. We provide volunteers with satellite imagery, and they can see the affected area and help to trace the buildings and roads and create maps of the area that was affected. Young people, old people… we really welcome anybody. We say anybody that knows how to essentially browse the web or use a mouse can become a volunteer with us.
Denver: Let’s go into a little bit more detail there about how this work gets done. You just said, a volunteer is presented with an aerial photograph, a satellite image. That’s going to appear on their desktop; then what happens?
Tyler: We have a three-step process to our work. Step one is, indeed, we have volunteers using their smartphones or sitting at their computers. We provide them with aerial imagery, and that comes from satellites, or it might come from drones in certain cases.
Denver: Getting better all the time, I bet.
Tyler: It’s getting clearer and clearer and more high resolution. Volunteers basically see an overhead view of an area, and what they’re typically seeing is rooftops, individual buildings. Sometimes, they’re square, sometimes they’re round depending on the area of the world that you’re looking at, and they’ll also see things like rivers, the road network. What they do is really basic. They actually trace those things almost like you’re coloring in a coloring book. They are drawing the black and white lines that form the basis for that coloring book. That’s step one.
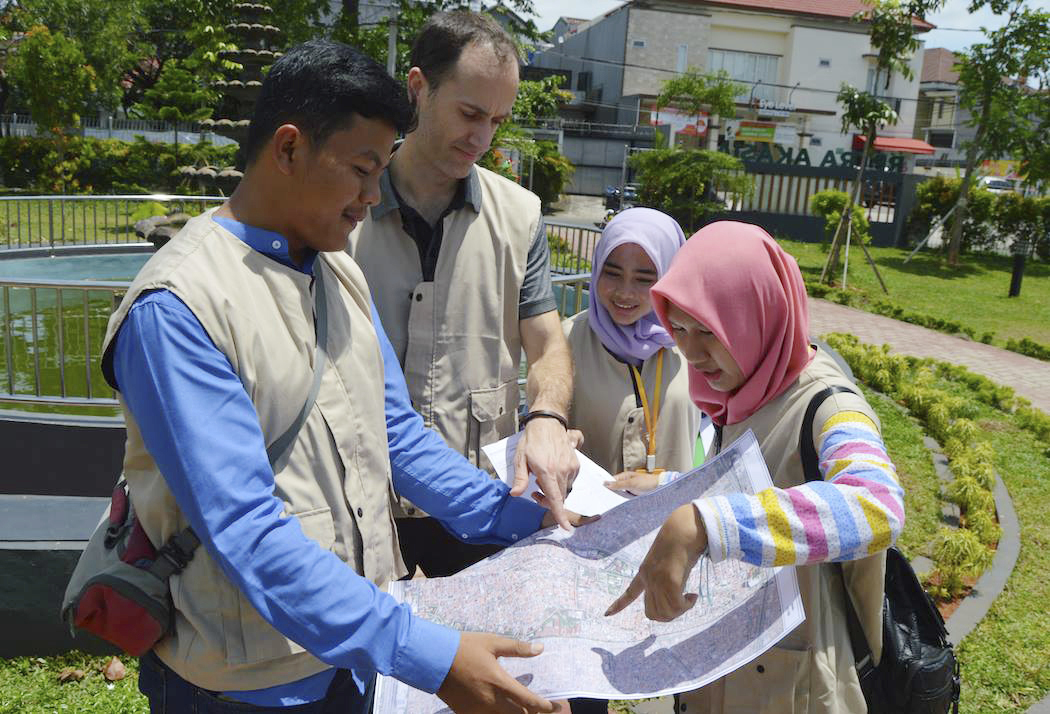
When we go to step two, we also have volunteers on the ground in about 50 countries around the world, and those volunteers are the ones coloring in the coloring book. So, they’re going out and collecting details that you can’t see from the sky. Things like: Was that square building a school or a hospital? Or was it somebody’s home or shop or a place of worship? That data is then made available for any relief organization to use in their relief efforts.
Denver: Question comes to mind as you’re talking: How in the world do you coordinate all this? You have all these thousands of volunteers. They all have these aerial images; how do people decide on who’s going to work on what?
Tyler: This goes back to Haiti. After the earthquake in Haiti, traditionally OpenStreetMap was a project, a really ambitious project to create this publicly available map of the entire world and do it in minute-level details. So, down to the individual structure, individual house or building level. As you’re probably aware from most printed maps, if you think about what appears on a typical road map, it’s things like – you see the names of villages, towns. You see major highways. You see some of the side streets. But you don’t often see each individual building in each individual alleyway…all that incredible detail… The OpenStreetMap project, when it was founded, the goal was to fill in all that detail at the hyper-local level. Since 2004, when the project started in the UK, volunteers could basically jump in, and they could start mapping wherever… the area where they lived, or the local area.
Over the years from 2004 to 2010, what ended up happening is, we got a lot of people mapping in the UK because that’s where the project started and expanded throughout Europe. So, volunteers were walking around using GPS devices, collecting data, where they lived in their town or village or neighborhood. The dramatic change we saw after Haiti is that, around that time, satellite imagery started to become more available to our volunteers, which meant that they no longer had to create maps in the place they live. They could get satellite imagery of another area around the world and start to trace that and create maps in a different place.
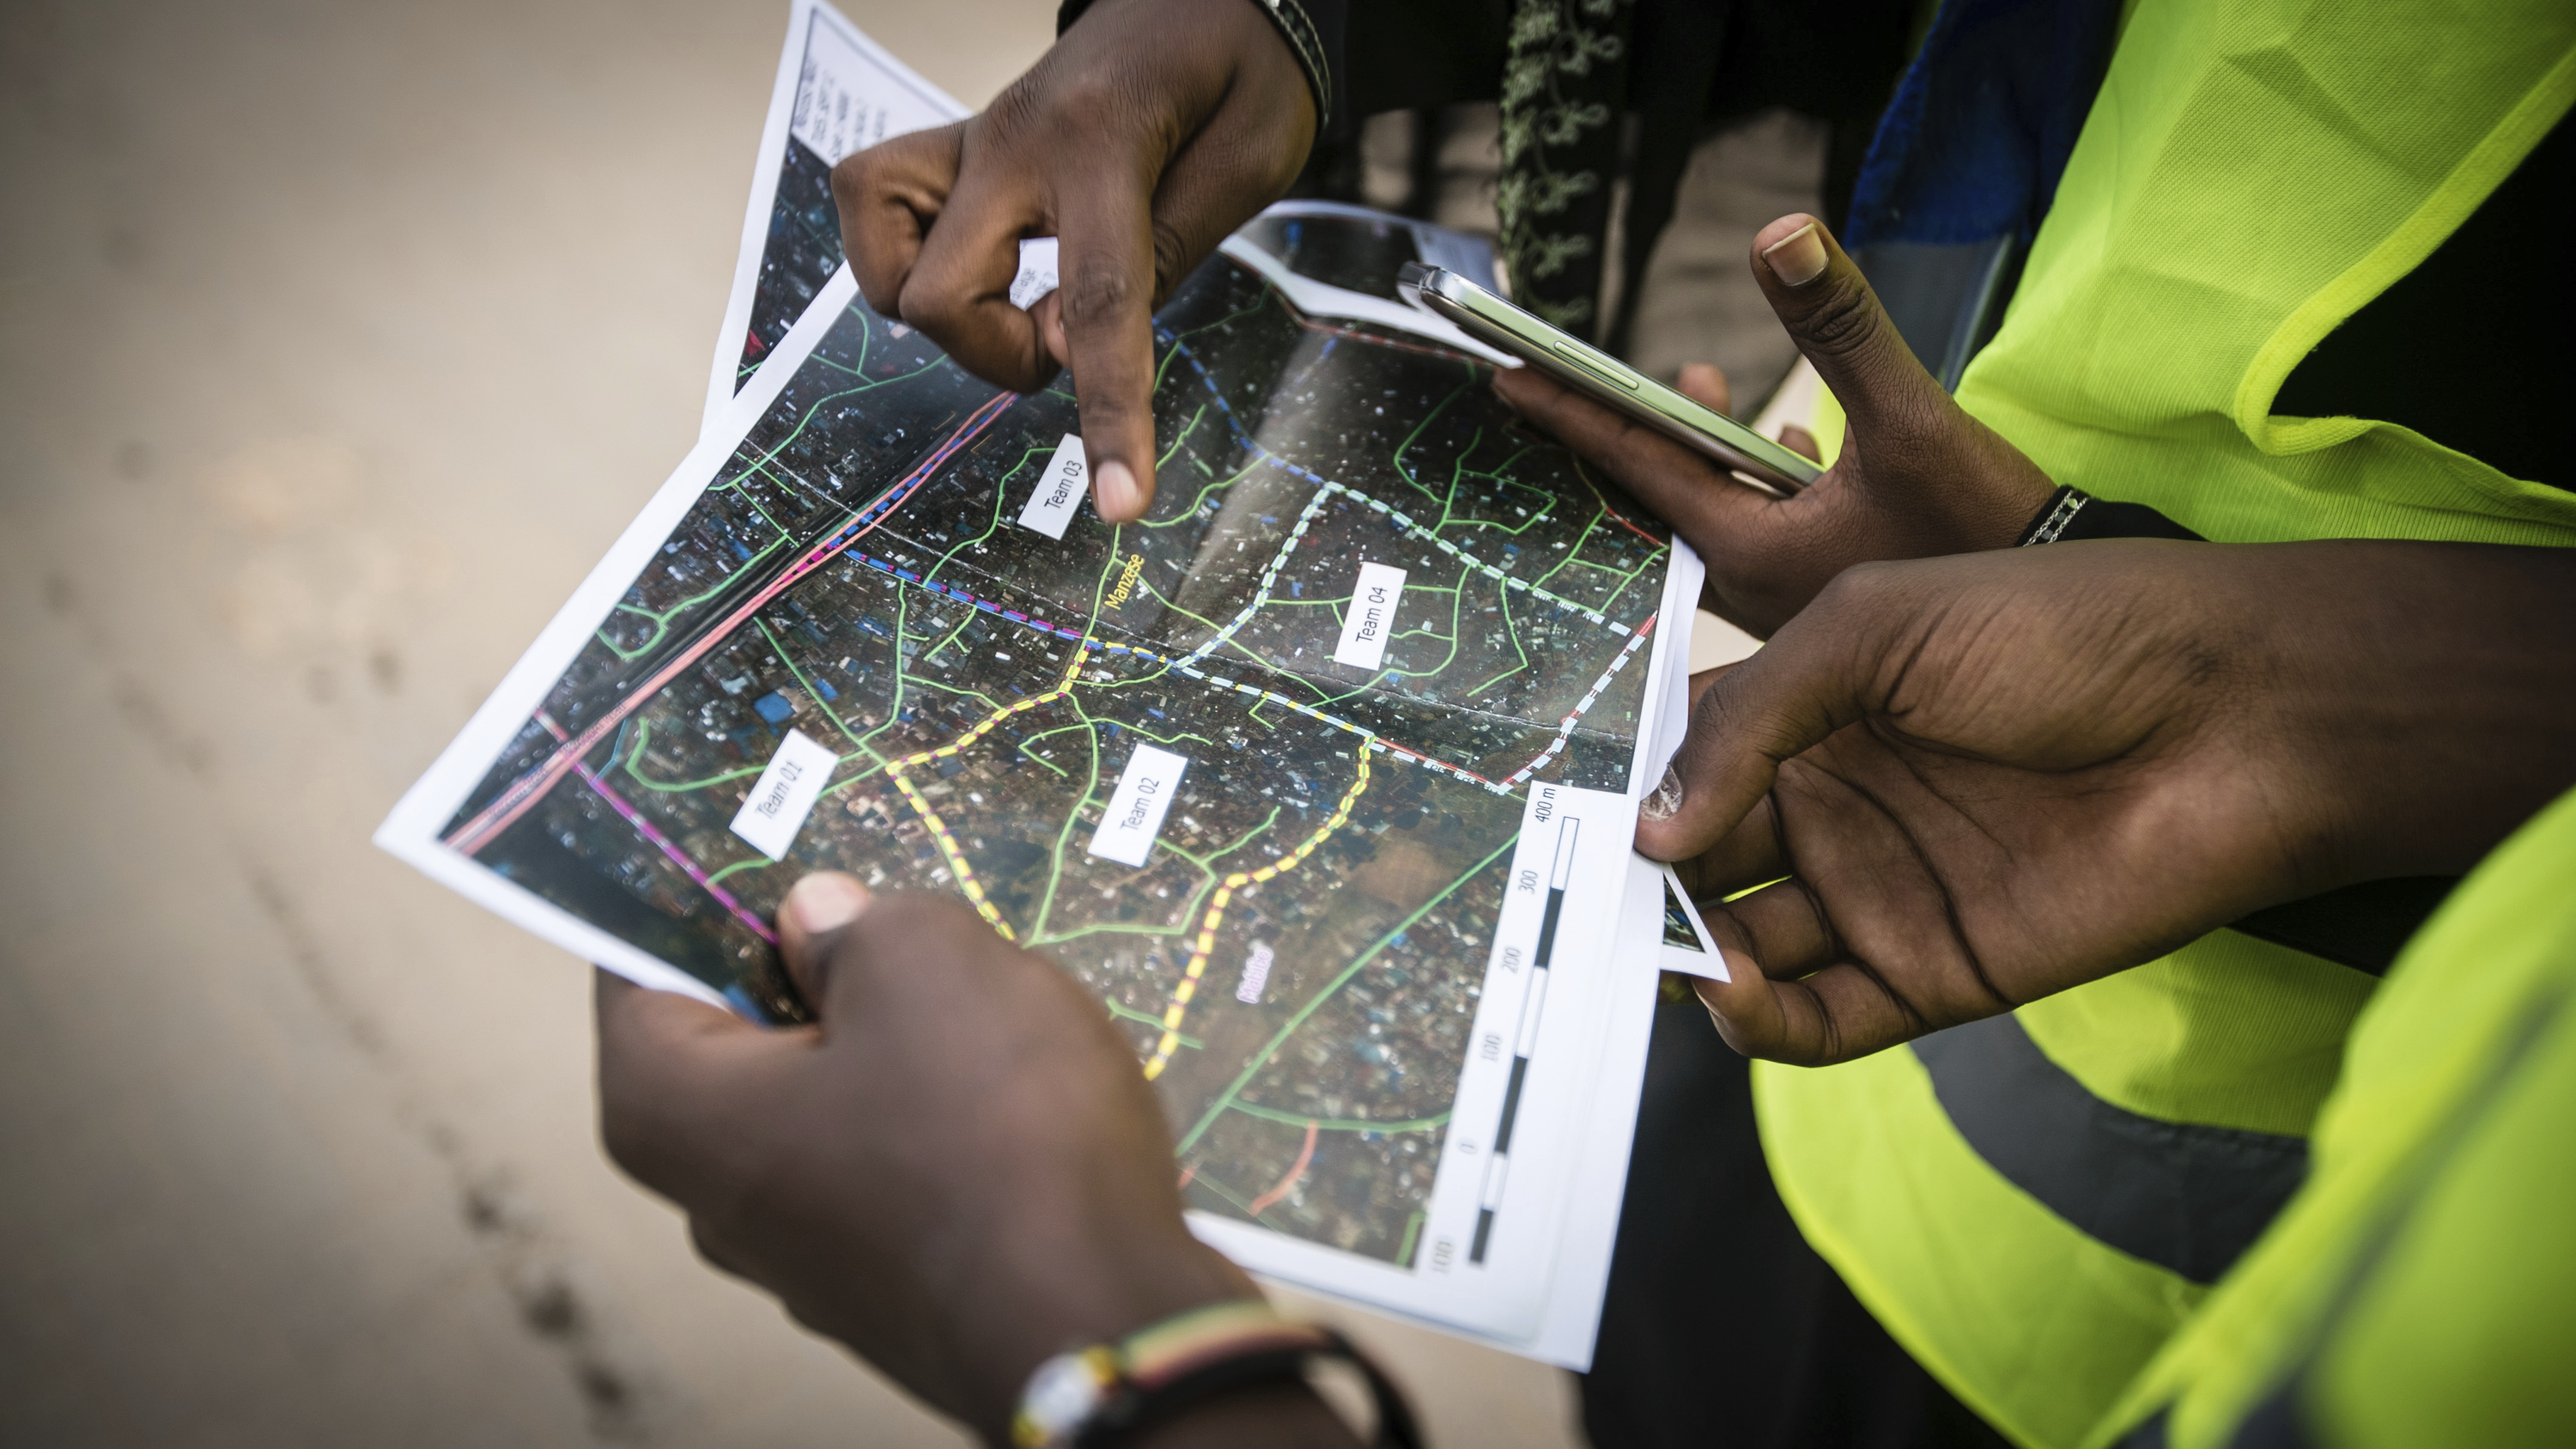
Now, you can imagine the challenge that causes because then you have potentially tens or hundreds or thousands of volunteers who are all working in the same place at the same time. So, how do you coordinate that? That’s the big question. We came up with a really simple solution which was basically, you put a grid over the area, a bunch of squares, and you assign each person to one square, and you say “I’m gonna work in this square,” and your volunteer or your neighbor who’s also mapping, “Stay out of my square and go work in the square next to mine.” We have an app, basically called our Tasking Manager, that splits up… it puts a grid over the map, and it helps to coordinate that volunteer effort. Now, even through today we’ve made iterations on that tool… up through 2018, that’s the main tool that our volunteers will use. It’s the Tasking Manager.
Denver: Simple solutions are always the best.
How, Tyler, do you assure that these volunteers are competent and in turn assure that the maps are going to be accurate?
Tyler: What really matters to us is that we are producing good enough data that’s fit for purpose for whatever it’s going to be used for. In some cases, the type of data that we’re producing might be different. When you think about a map, a lot of people are again thinking about a printed roadmap for navigation. But that’s not always the type of thing that we’re creating. Sometimes, we’re creating a map that shows every house in the village, or sometimes we don’t care so much about the roadmap. Other times, we’re creating a map that shows the road network, so that we can use it for navigation after a disaster.
When volunteers come and work with us, we help them to understand, number one, what type of data is needed for that particular challenge that they’re working on; and number two, we show them examples of prior work in that area. So, we’ll show them what buildings look like. So, if they’re working in some countries in Africa where buildings are typically round, we’ll give them some example – overhead views, and say, this is what a building looks like. Sometimes, we’ll even provide them short, two- or three-minute tutorial videos of other people doing the work. Basically, that’s it. The training can be as short as five minutes. They jump in and start working. That’s really all that’s needed. We have some other processes through which people can come in and help to validate and correct the data that’s created in the first pass.
Denver: We’ve talked about Haiti. Let’s move ahead to Puerto Rico. How did your team of volunteers respond to Hurricane Maria?
Tyler: Hurricane Maria was a really another devastating event for Puerto Rico. Many people even today in 2018 are still recovering from the event. For Hurricane Maria, I remember the situation was a little unique because we were working in the United States first of all, which is a little bit different for us. We are typically working in other countries. In Puerto Rico, we did have some basic maps already available. It wasn’t like Puerto Rico was a completely unknown location with very limited data. There were roadmaps publicly available for navigation for the most part. What wasn’t available always was precise counts of buildings.
As we know, we live in a dynamic world. Things change over time. New construction happens on a year-to-year basis. What we didn’t have in Puerto Rico was, for example, after the hurricane, we didn’t know how many individual homes or structures were in each specific town. What we had our volunteers focus on was actually digitizing each and every building across the entire island. We are really proud to say we accomplished that in a short time frame. Now, that data is open to anyone on OpenStreetMap.org. I think what the goal there was was to really help the relief organizations that were working on the ground, especially in vulnerable areas… I’m not sure if you recall, there was a dam that was vulnerable to collapse after the hurricane. There were certain families who lived in the potential inundation zone that would have been devastated if the dam collapsed. What we did, we were able through our work to quantify that and provide an answer to say, “These are precisely how many households might be affected, and these are the types of humanitarian supplies that would be required if that event takes place.” So, we can start to get into more, beyond navigation, and start getting to more interesting analysis and provide answers to some of those humanitarian questions that come up.
Denver: To the institutions on the front lines in these disasters; Red Cross, Salvation Army, Doctors Without Borders… do they fully understand and appreciate the role that HOT is capable of playing? Or do you find this to be an ongoing educational effort?
Tyler: It’s a little bit of both. I would say that our organization is close partners with American Red Cross and with Doctors Without Borders through a program we call Missing Maps. Missing Maps is one of our initiatives to help get ahead of disaster, work in vulnerable areas around the world to fill in this missing map data before disaster takes place. We collaborate with those organizations to help identify which areas are most vulnerable, which areas are priorities to them, and then to get ahead of things and put our volunteers on those areas before an event takes place.
In terms of education challenge, many of the larger humanitarian organizations have some capacity or have built some capacity inhouse to understand information and data and how to use it in a disaster. That’s not always the case for some of the medium-size or smaller organizations. What we work to do is help build that capacity, provide training to those organizations, and provide really basic and free tools that they can use to get a hold of our data and make use of it.
Denver: We’ve been talking about mapping in connection with disaster response, but these maps are also critical tools in development and are used in other ways as well from Tanzania to Uganda. Give us an example of some of the ways that they’re used.
Tyler: Outside of natural disaster, what we found is that maps can really be used to solve any type of development challenge. When we’re thinking about how to organize or run a program around public health or financial inclusion, maps can be a really powerful tool. I’ll give you a few examples of that. One of the projects we’ve worked on over the past year was around malaria elimination, and there are basically two main types of interventions around malaria. Number one is distributing bed nets which prevent mosquitoes from biting while you’re asleep. The other one is indoor residual spraying, which is essentially spraying insecticide on the interior walls of a residential dwelling.
In order to carry those things out, we need to know a few basic questions. Number one: Where do the people live? How many people are there in a specific village? How many residential structures are there in a village? And we want to know what the approximate size of that structure is so we can quantify how much insecticide needs to be transported to that location. One of the things we’re working on right now in Botswana is to have teams on the ground to actually go out and visit rural villages and put each and every household on the map in OpenStreetMap for the first time. Through that process, then our partners who are carrying out some of the spraying activities are using that data to make sure they’re hitting their minimum thresholds.
What I neglected to mention is you need to cover roughly 80% of the homes in the village through this indoor residual spraying for the spraying to be effective. If you don’t know your denominator, how many homes are in the village, it makes it really hard to hit that 80%. So, that’s one of the really clear-use cases for these maps is that you can then use it to just do these very basic calculations to make sure that your intervention is effective.
Denver: With the kind of work you’re doing, Tyler, I was wondering if you’ve begun to integrate AI and machine learning into your workflow.
Tyler: One of the questions we get quite frequently is: Why do you have people sitting in a room drawing squares around buildings and tracing roads? For some people, it could be sort of like a relaxing and meditative activity, and they love it. Absolutely love it. For other people, they say there’s got to be a better and faster way to do this. So, what we’re working on now, and we do this through a few of our technology partners, is thinking about how machines are not going to replace humans, but how they can assist humans… How they can make humans better and more effective, more accurate and faster at their work. We’re doing things like looking at, for example, how machines can look at a satellite image and gauge how difficult that mapping would be. How dense is that area? Roughly, how many homes might be in that area? We can use that to better task our volunteers.
I mentioned our Tasking Manager software earlier. This would help get the right task to the right skill level of volunteers. There are many other ways it could be used as well… for example, in the data quality or data assurance process. Machines could help to tell us whether the work that a mapper did was in fact accurate, precise, or whether there are things that perhaps were missing or need to be looked at by a human. It can assist in that data quality process.
One more thing I’ll mention, too, is, many of the technology partners we’re working with are looking at really ambitious projects right now. Essentially, extracting the buildings and the roads in entire countries… and they can do this with some of the cloud computing resources that they have available now. Really, I think within the next few years, we’ll see a time when a lot of the first steps of our process– where volunteers are doing the tracing– a lot of that will be heavily assisted through this machine learning.
Denver: Tell us a little bit about those technology partners, and your other partners as well, in terms of how your organization is financed.
Tyler: Many of our tech partners are the biggest technology companies that you can think of right now. Many of them are switching over to use OpenStreetMap internally. Why are they doing that? Because it’s a free source of data. And quite frankly, as more companies are moving into emerging markets, it’s the best source of geospatial data for that market. Any time where you see a map in their app or in their website, many times it’s powered by the data that our volunteers are creating in OpenStreetMap.
In terms of financing our organization, I think this is a bit of a unique and probably interesting model. Like many nonprofits – we’re working through a puzzle; always trying to piece together bits of funding to keep the basics happening and keep our operations moving forward. We find ourselves sometimes in that situation, facing that challenge. But at the same time, we have a lot … what we’re seeing in the past few years is many of the world’s largest organizations such as the World Bank, for example, is really focusing on doing things out in the open– open data, open source software, and are really emphasizing creating this type of open data in OpenStreetMap and using it for all their… as a basis for many of their other development projects.
Many of the partners who fund us, such as the World Bank are looking to us to help organize the creation of this data that is then going to serve as the basis for future construction projects or future education or health projects down the road. A good chunk of our funding comes from those international organizations, and then some of our corporate partners who I mentioned who are working on machine learning, we have some partnerships with them to fund our technology projects. Then finally, some of the humanitarian partners that work with us like MSF or the American Red Cross also help to support our tools. Why do they do that? Because they are now starting to use and rely on those tools for their own operations.
Denver: You also help some folks through your micro-grant program. What’s the purpose of that? And who are some of the recipients?
Tyler: One of the things about our organization, HOT or Humanitarian OpenStreetMap, is that we’re not structured as a typical nonprofit in the sense that we don’t have a central headquarters. We were talking about this earlier this morning, but our office in DC has typically zero people sitting in it. Our structure is much more distributed. We have people all around the world. One of our goals is to really set ourselves up as not a typical NGO, not a nonprofit, but a global movement. One of the ways we see in furthering that movement is supporting volunteers who want to map their countries. It’s not sending in large teams of international staff to create maps. It’s working with people who already live in that country, who already know their communities and neighborhoods, and helping supply them with the basics they need to get the job done.
And what they tell us often is that it’s things like: sometimes it’s equipment; sometimes it’s things like laptops and phones or GPS devices. More often than not, we need internet connections. We need money to pay for cell phone connections. We need basic office space to do work. This micro-grants program is a program by which any open data or OpenStreetMap volunteer community around the world can say, “I have these needs. I want to map for these things in my country. This is an issue in my country.” We’ll say, “Here’s a little bit of money; go do it. Make it happen.” They’re the ones who design the project. They’re the ones who come up with the budget. We help support that effort. What we want to get out of it over time is that we hope that these volunteer communities will become self-sustainable, and that any time if a disaster happens in that country in the future, we’ll already have this relationship. We’ll have people on the ground that we can work with, and we won’t have to start from scratch. It’s a future-proofing effort.
Denver: A very 21st century model, if I might say so. The value of what you do is abundantly clear. How do you go about measuring the impact of all this work and the difference that these maps are making, for instance, in a disaster relief situation?
Tyler: We’re actually going through a global effort right now. We have some consultants helping us with this in terms of monitoring and evaluating our work. It’s very easy for us to monitor our direct outputs, and when I say direct outputs, it’s things like: How many map edits have you made? How many families have you put on the map? We’ve had some really impressive numbers over the past few years. As you mentioned, we had over 130,000 volunteers work with us. We’ve made hundreds of millions of edits to the world map in OpenStreetMap. We estimate that we’ve, through our missing maps partnership, our partner organizations, along with us, have put an area– home to 70 million people– on the world map. So, we’re extremely proud of those accomplishments.
But again, those are really quantitative. They’re talking about numbers– how many areas we’ve mapped, the number of map edits. It’s really hard for us to measure the impact on human lives and the impact on reduced human suffering, which is really what we talk about in our mission. That’s the end goal for us… is to reduce human suffering, to reduce loss of human life post-disaster.
We rely a lot on stories to do that…. To tell the story and to measure our impact, we rely a lot on our partners who actually use the data. You mention Hurricane Maria in Puerto Rico, our volunteers did the mapping. The American Red Cross was on the ground using that data. They did really simple things like provide us with photos back from the operation center in Puerto Rico. Those photos of maps hanging on the wall and maps on GPS devices really make a difference. It really helped to see, okay, they are actually being used for something on the ground. And at the end of the day, I think that’s what motivates our contributors; they see that this isn’t an abstract exercise. It’s something that within days is going to be used on the ground.
Denver: They have to see that impact and feel that impact. I saw those pictures, and they were quite impressive. You mentioned you’re a bit of an atypical nonprofit organization and probably have a bit of an atypical workplace culture. I always find organizations that are virtual like this and around the world and with lots of volunteers have some of the most interesting and fluid cultures. How would you describe your corporate culture, Tyler? And what do you do to shape it and guide it?
Tyler: I love our corporate culture. I was thinking back on this the other day. After Haiti, after the earthquake in 2010 going into 2011, we produced some really fantastic results on the ground for Haiti, and we started to get interest from donors in saying, “Could this be done in another country perhaps?” We started to work in Indonesia at that time. It was also the time at which we said… donors were asking, “What’s your address? We want to give you a grant.”
Like some other nonprofits have experienced: “Oh, crap! We actually now need a mailing address. We need to be registered as a 501(c)(3). There’s all these legal and administrative steps that we need to take.” So, that was at that time– 2011, we started doing those things, and we’ve now gotten to the point where we’re both this volunteer movement, and we’re also a typical NGO on the other hand. We work really fluidly between this loose movement and the typical structure for a nonprofit or an NGO. In terms of our culture, I think that’s really…the reason I explained that is that is at the base of what makes our culture unique.
We’ve still kept some things from 2010, which is that people can work from anywhere. If you’re a volunteer with us, or if you’re a paid staff member, you’re typically working remotely in a home office or in a shared co-working space. Our head office in DC, as I mentioned, has zero people sitting in it most of the time. We use it for meetings and gatherings, but not often for sitting together in a typical office environment. I think one of the things that’s made our culture unique is that we’ve been really fortunate to build this culture of trust. And when we hire people, we’re often hiring them sight unseen. We’ll do interviews over Skype or video conferencing, and we’ll need to make a decision based on the person’s skills and qualifications, but also somewhat on our intuition… We haven’t met them in-person.
For the most part, amazingly, it’s worked out. We’ve hired really good staff who want to go above and beyond and actually work above and beyond the typical work day, even though we allow, permit our staff to work flexible hours most of the time. I’m not quite sure if we’ve figured out the magic recipe yet, but I think that’s gone a long way to just… when you empower people with trust to get the work done, and you focus on deliverables and outputs and less on clocking in from 9 to 5, that’s really enabled people to produce their best work.
Let me close with this Tyler. Where do you go from here? You’ve given this a lot of thought, I know, and you’re thinking about the strategic direction of the organization between now and 2020 and beyond. What do you envision the next chapter of HOT to look like?
Tyler: We have a draft plan in the works right now. We have a really big vision. Our vision is to have that literally every person in the world is counted by appearing on the map. It’s a really powerful statement that for many people who have never appeared on the map to say, “I exist, I am here, I am important, I matter.” Our organization’s goal over the next few years is to make sure every person in the world is counted, and we do that by helping them to appear on the map in whatever way they would like to do that. That’s number one; that’s the starting point.
I think number two, is to make sure that data is accessible and used so that every humanitarian organization, every international development organization, every local NGO has access to the data and knows how to use it… So we help to provide that knowledge and basic training on how to use it with the end goal, as I said, to really make the humanitarian system just a bit more effective. If we calculate, there is something like $25 billion in aid required for the entire humanitarian system as a whole this year; roughly 100 million people affected by humanitarian crises. This seems like a big number. If we can just make that 1%, 5%, 10% more effective through the use of map data, just imagine how many lives could potentially be saved or how much suffering could be reduced. That’s our vision. That’s where we’re going.
Denver: Lots of leveraging and big ambitions. Tyler Radford, the Executive Director of HOT, the Humanitarian OpenStreetMap Team. I want to thank you so much for being here this evening. If people want to learn more, support the organization, or maybe even become a volunteer, what’s your website and what’s on it?
Tyler: Volunteers or anyone interested can go to our website, hotosm.org.
Denver: Thanks Tyler. It was a real pleasure to have you on the show.
Tyler: Thank you very much, Denver. It’s great to be here.
Denver: I’ll be back with more of The Business of Giving right after this.


