
New App From the Metropolitan Opera
For more than five years, the Metropolitan Opera has broadcast performances in movie theaters. Now the New York opera company is turning its attention to tablets. Met Opera on Demand is a new application for the iPad that gives people access to 44 productions that have been part of the “Live in HD”…
By NICOLE WALLACE
Features Editor
A Simple Map Can Help You Reach the Right Clients
Maps can help charities make sure they’re reaching the people who most need assistance, says a nonprofit technology expert.
By NICOLE WALLACE
Features Editor
Employee Feedback Helps Nonprofits Refine Programs
Many groups are finding creative ways to solicit ideas on how programs are going and what workers hear from clients.
By NICOLE WALLACE
Features Editor
Matching Data Scientists and Nonprofits
New group seeks to give nonprofits help analyzing information that affects programs and operations.
By NICOLE WALLACE
Features Editor
Walkathons and Athletic Events Raise More Money in 2011
In 2011, the top 30 fundraising walks, runs, and rides brought in almost 2.5 percent more than the year before.
By NICOLE WALLACE
Features Editor
New Site Aids Evaluation Process to Increase Impact
PerformWell offers questionnaires and other tools charities can use to assess their performance.
By NICOLE WALLACE
Features Editor
Nonprofit Data Visualization: a Gallery
Twelve colorful examples of infographics and interactive data tools created by charities.
By NICOLE WALLACE
Features Editor
Interactive Graphics Can Enhance Supporters’ Engagement
As the cost and difficulty of producing such infographics has gone down, more nonprofits are finding ways to let people find their own stories in data.
By NICOLE WALLACE
Features Editor
A Charity Adds Design Expertiseto Its Small Staff for Big Results
A Child’s Right, which provides clean drinking water in developing countries, hired a designer who could help people visualize the group’s mission.
By NICOLE WALLACE
Features Editor
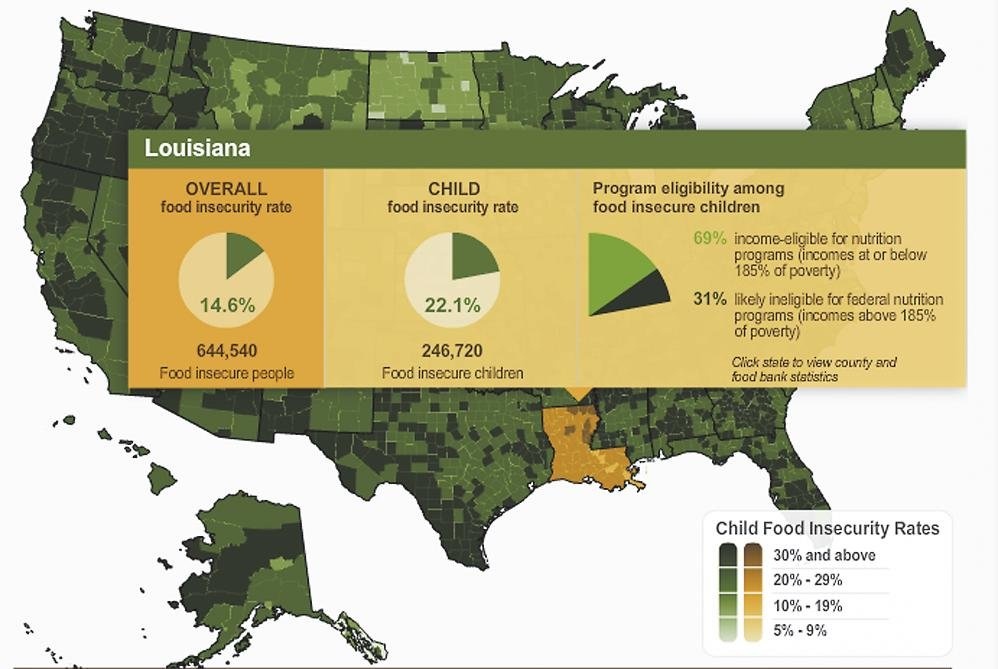
Visualizing Data Helps Charities Get Attention
Data-rich graphics are transforming how nonprofits reach the public and helping them improve the way they serve others.
By NICOLE WALLACE
Features Editor